
Technical Analysis Articles
Read Candlesticks as Evidence, Not as a Prediction Machine
Learn a context-first process for reading open, high, low and close data while avoiding the familiar trap of naming patterns without testing them.
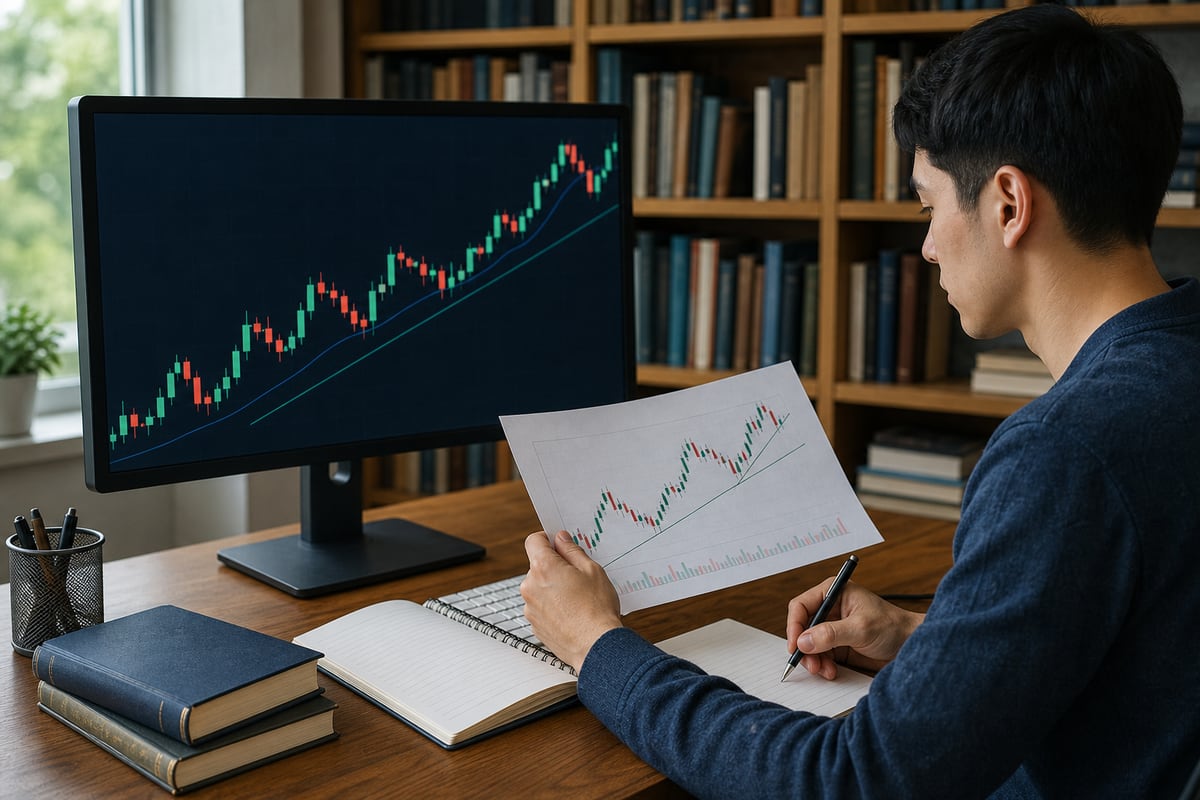
Educational use only: chart analysis is uncertain and does not predict returns. This guide teaches observation and documentation, not a trading recommendation.
A candlestick is a compact record of four prices over a chosen interval: open, high, low and close. Its body shows the distance between open and close; its wicks show prices reached outside that body. That information is factual for the selected data source and interval. The story attached to it is an interpretation, and interpretations should be tested against context.
Begin with the chart’s basic contract
Before reading a candle, identify the instrument, venue, timezone, price type, interval and whether the current bar is complete. A daily candle built in one timezone can differ from one built in another. A crypto venue may show a different wick from another exchange. An unfinished bar can change shape before the interval closes. These details are not housekeeping; they determine the evidence being analyzed.
Describe first, interpret second
Use neutral language in the first pass. For example: “The interval opened near its low, moved above the prior interval’s high and closed in the upper part of its range.” That is more useful than immediately naming a bullish pattern. Description makes assumptions visible and gives another learner a chance to reproduce the observation.
- How large is the full range compared with recent ranges?
- Where is the close within that range?
- Did price overlap previous candles or move beyond them?
- Did the move occur near a previously observed area?
- Was the candle formed during ordinary or unusual activity?
Context changes the meaning
The same shape can appear after a prolonged move, inside a quiet range or during a sudden event. It does not carry one fixed message across all three settings. Mark broad structure before studying individual candles: a sequence of higher or lower swing points, a balanced range, a gap, a sharp expansion or a return to a former area. Then ask what new information the candle adds.
Timeframe matters too. A strong-looking five-minute candle may be a small wick inside a daily range. A daily reversal may be ordinary fluctuation inside a multi-month trend. Use a higher interval to identify context, a working interval to define the observation and, only if useful, a lower interval to inspect execution detail. Do not collect intervals until one supports the desired conclusion.
Patterns are hypotheses
Names such as doji, engulfing candle or hammer are shorthand for geometry. They are not complete decisions. Convert a named pattern into a testable statement: what happened before it, where did it form, what would confirm the interpretation and what evidence would invalidate it? If those conditions are vague, the pattern is decorative rather than analytical.
The CME Group technical analysis course offers additional first-party education about chart concepts. Treat any technique as a framework to examine, not an assurance of outcome.
Build a three-layer chart note
- Observation: record only visible price and, if used, volume relationships.
- Interpretation: list at least two plausible explanations for those facts.
- Test: state the future evidence that would support or reject each explanation.
For a neutral example, an unusually wide candle closing near its high could represent urgent demand, a temporary reaction to news or thin liquidity. Follow-through above a defined area may support one explanation; immediate return through the range may support another. The purpose is not to forecast perfectly but to define what evidence would change the view.
Use indicators as transformations, not extra votes
Many indicators are calculated from the same price data shown by candles. Adding several momentum indicators may create the appearance of independent confirmation when they are related transformations of one input. If an indicator is used, write what it measures, its lookback and what new question it answers. Remove it if the answer duplicates the price description.
Review with screenshots and timestamps
Save a clean before-image, the written hypothesis and an after-image at the planned review time. Do not judge the note only by whether price later rose or fell. Ask whether observations were accurate, alternatives were genuine, invalidation was clear and the review occurred as planned. A sound process can accompany an unfavorable outcome; a weak process can occasionally accompany a favorable one.
Good chart reading is disciplined compression. It reduces a large stream of prices into facts, interpretations and tests while preserving uncertainty. The candle is evidence. The learner’s responsibility is to avoid turning that evidence into certainty it cannot provide.